
International
ADVANCED AND APPLIED SCIENCES
EISSN: 2313-3724, Print ISSN: 2313-626X
Frequency: 12
![]()
Volume 11, Issue 5 (May 2024), Pages: 96-102

----------------------------------------------
Original Research Paper
Designing resilient bicycle paths in Puno, Peru: Combating urban CO₂ emissions with GIS analysis
Author(s):
Affiliation(s):
Academic Department of Architecture and Urbanism, Faculty of Civil Engineering and Architecture, Universidad Nacional del Altiplano de Puno, Puno, Peru
Full text

* Corresponding Author.
 Corresponding author's ORCID profile: https://orcid.org/0009-0009-1388-1058
Digital Object Identifier (DOI)
https://doi.org/10.21833/ijaas.2024.05.010
Abstract
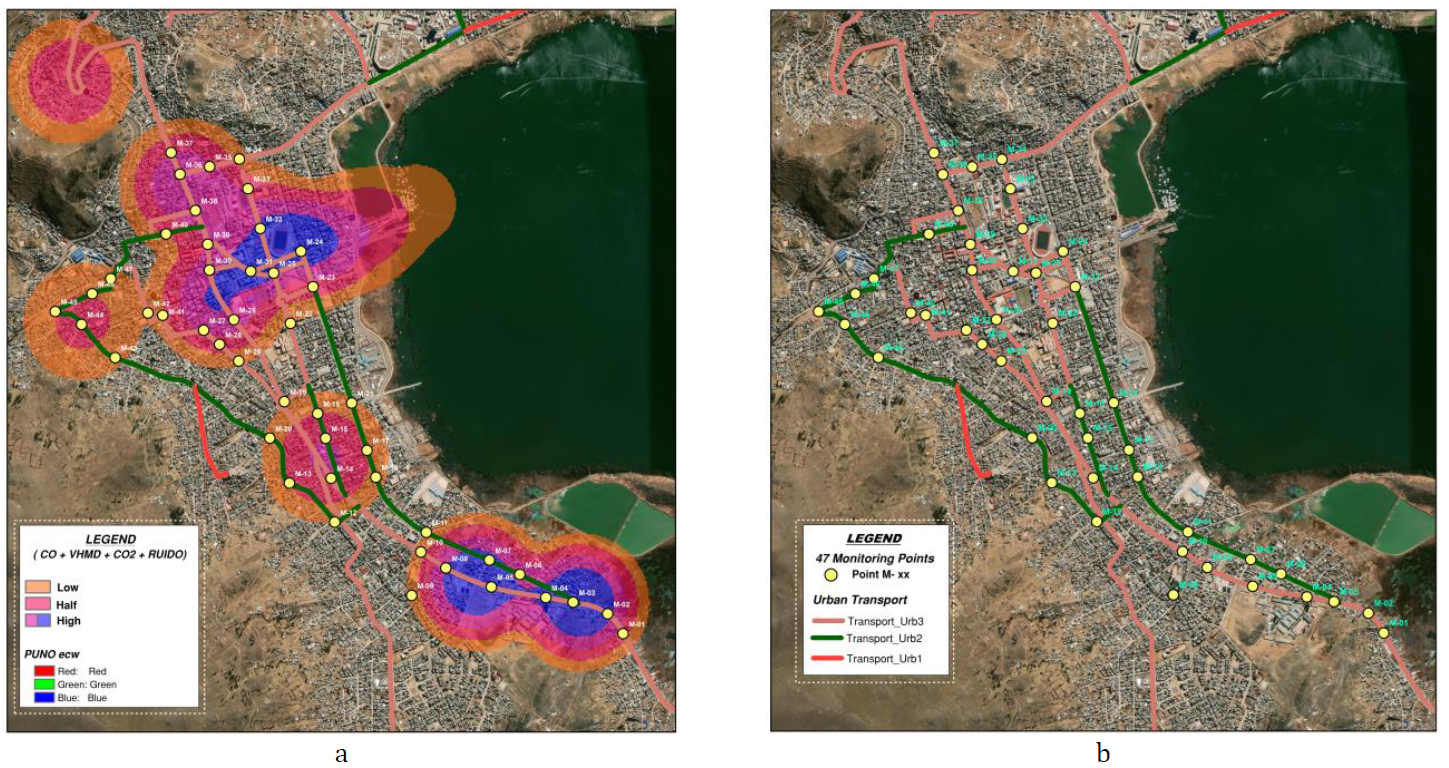
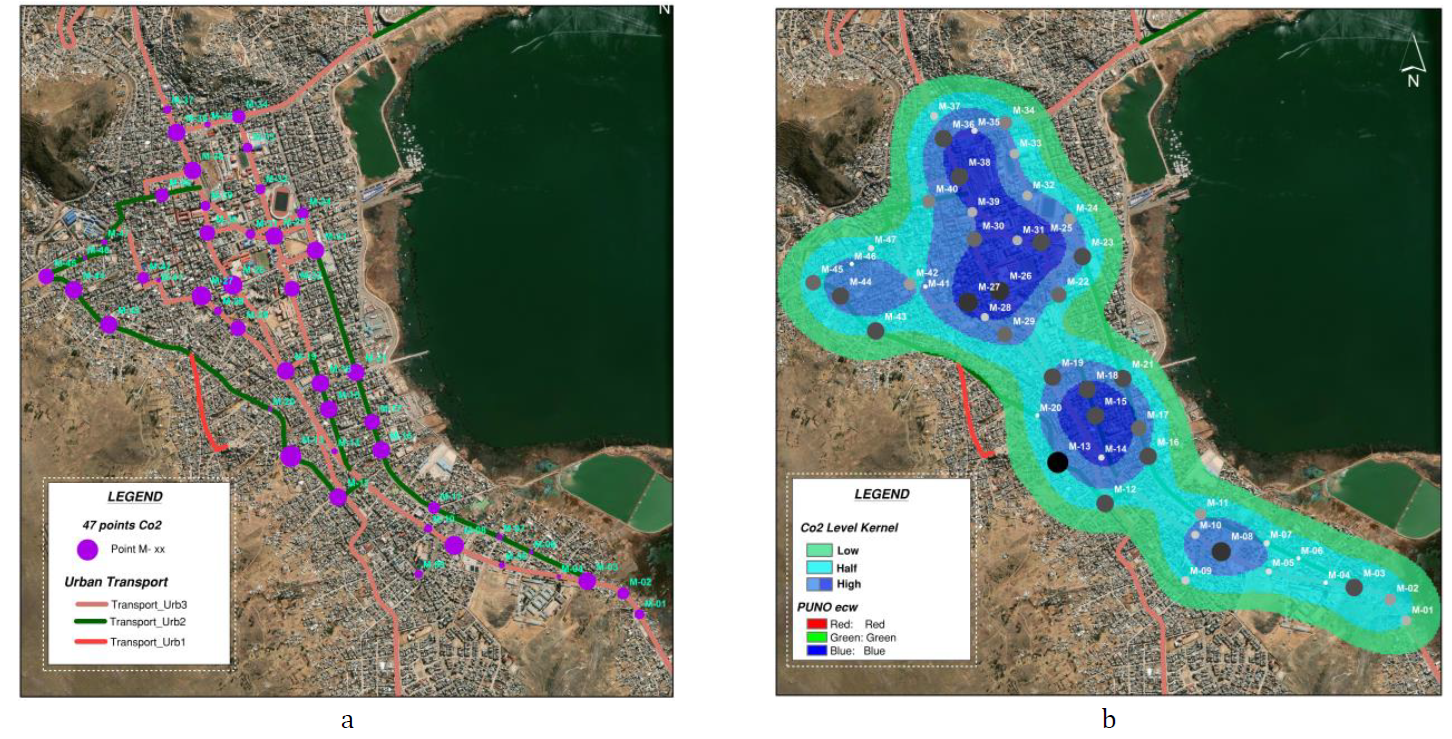
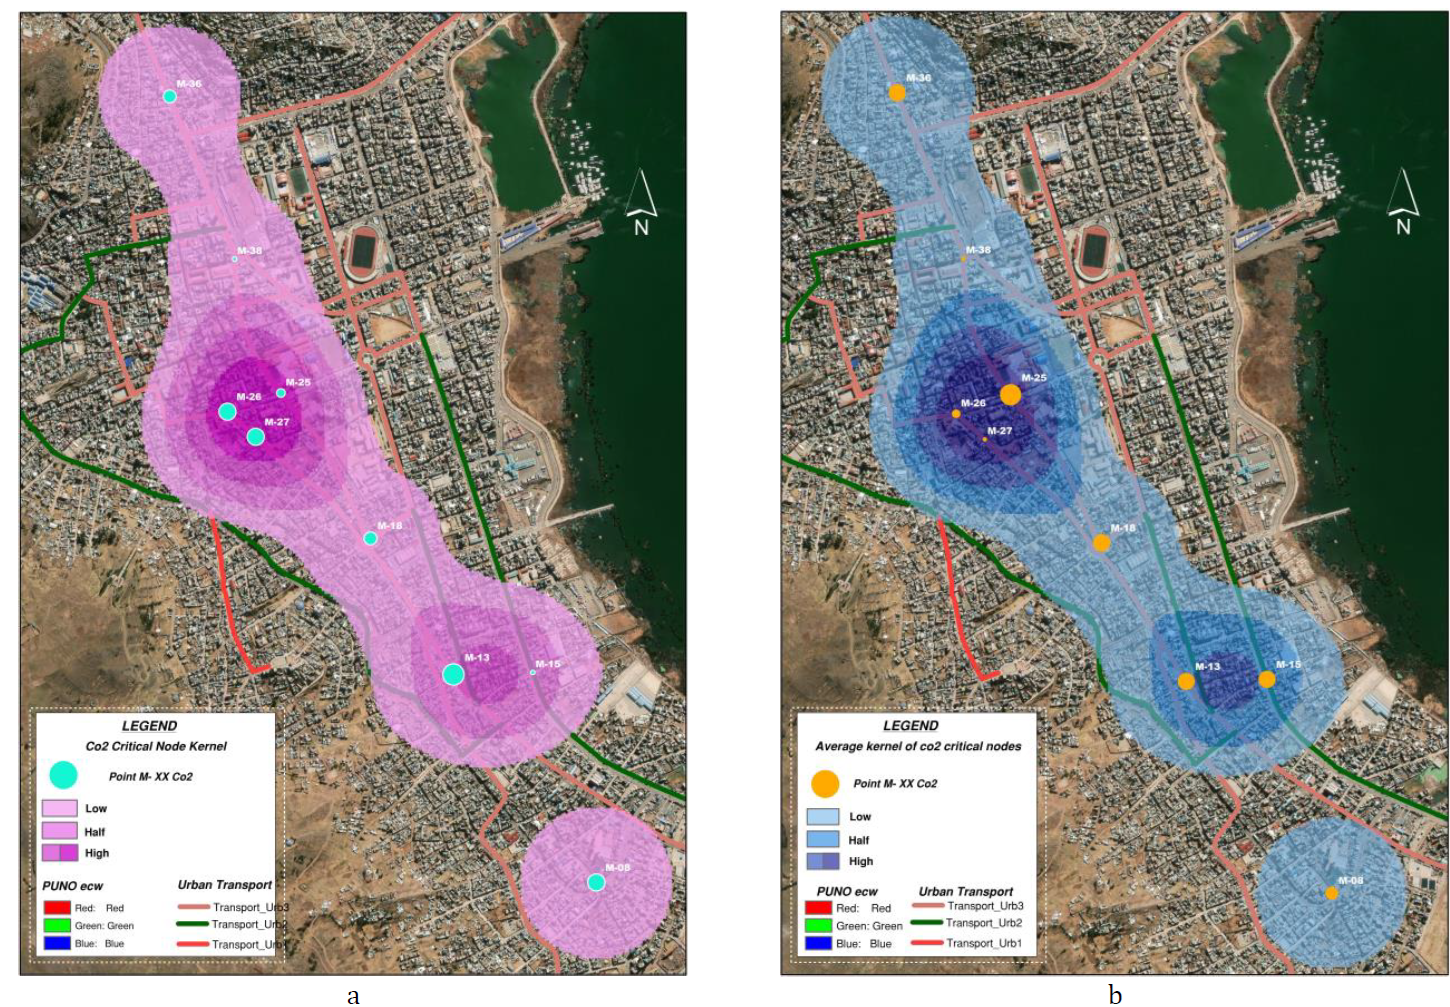
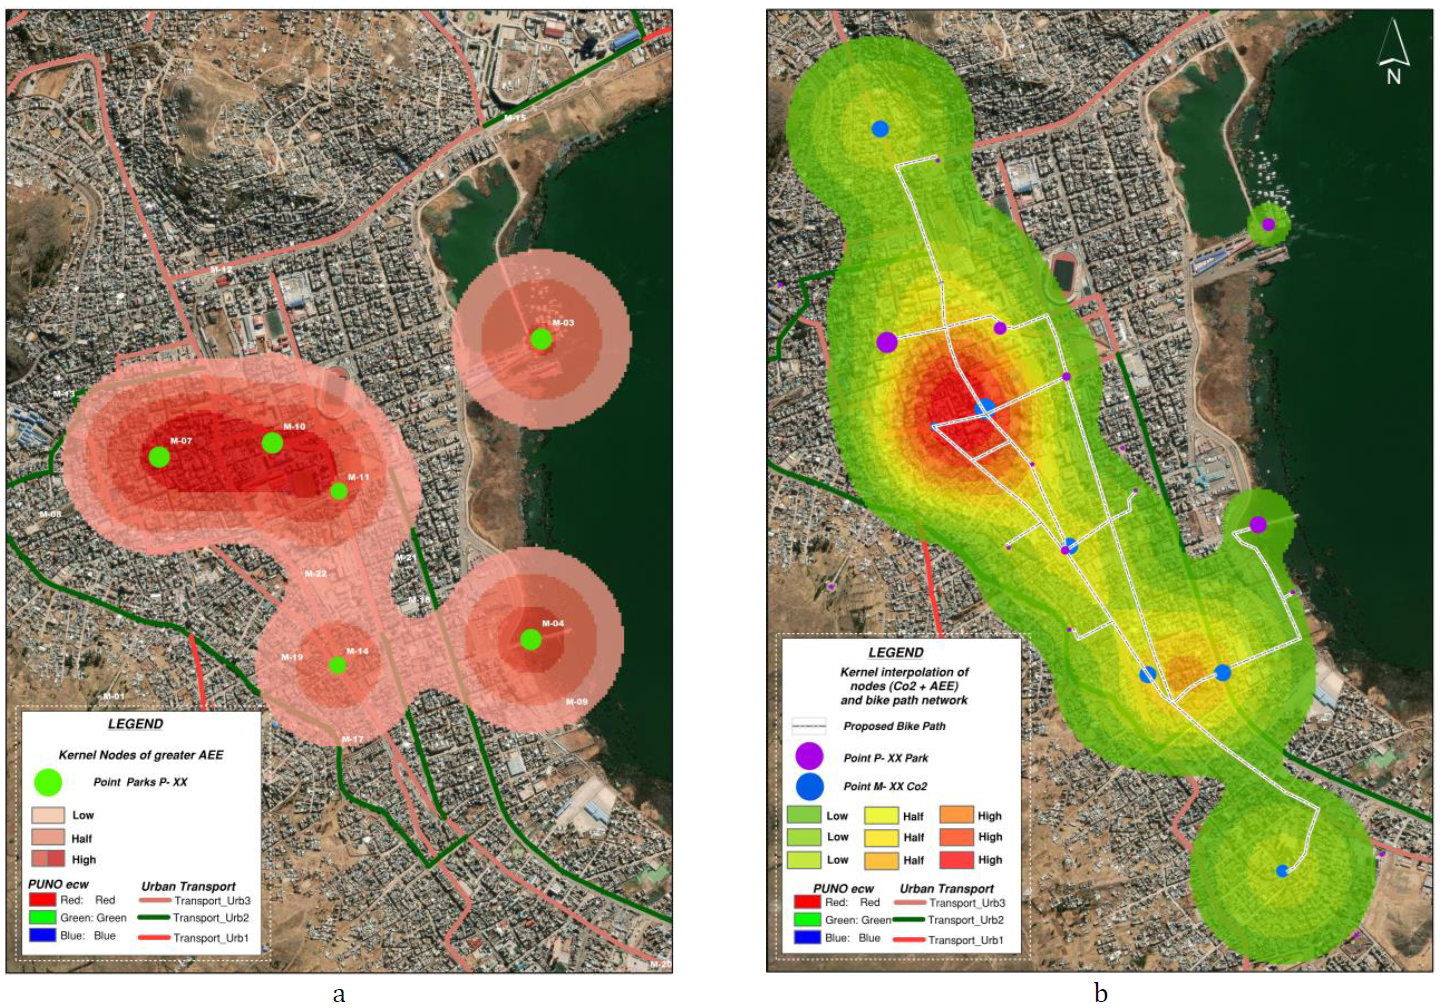
This study watched over the amount of CO₂ gas that cars and other vehicles put into the air in Puno, Peru. The goal was to create a plan for bike paths that can last through tough conditions. These paths would lead to places where people can relax and have fun and also focus on the parts of the city with the most CO₂ pollution. This was done using a tool called Geographic Information Systems (GIS). The researchers figured out how much CO₂ was in the different areas of the city, pointing out places with a lot of CO₂. They also looked at how easy it is to get to places where people go for fun (called Affluence of Recreational Spaces or ARS) and used maps to show how CO₂ levels and ARS relate to each other. They measured CO₂ using a method called Kernel density in a program called QGIS. To find out about ARS, they asked 350 people questions in person and online using Google Forms, with answers based on a rating scale. This study was done after the COVID-19 pandemic in 2022. The researchers put all their information into a GIS system using map math and checking how everything connects. Their findings showed that places with more CO₂ and ARS were linked. The city had a lot of CO₂ - 615.76 parts per million (ppm), which is 76% more than what is considered natural. They found nine main spots in the city with the most CO₂, the highest being 713.49 ppm. They also identified six spots that were most popular for fun activities. By looking at both CO₂ and ARS spots, they made a plan for bike paths totaling 8,849 meters. These paths would link to the main fun places in Puno.
© 2024 The Authors. Published by IASE.
This is an
Keywords
CO₂ emissions, Bicycle paths, Geographic information systems, Urban pollution
Article history
Received 14 October 2023, Received in revised form 27 March 2024, Accepted 29 April 2024
Acknowledgment
No Acknowledgment.
Compliance with ethical standards
Conflict of interest: The author(s) declared no potential conflicts of interest with respect to the research, authorship, and/or publication of this article.
Citation:
Inchuña JNB, Calisaya Rojas LC, and Mamani GM (2024). Designing resilient bicycle paths in Puno, Peru: Combating urban CO₂ emissions with GIS analysis. International Journal of Advanced and Applied Sciences, 11(5): 96-102
Figures
Tables
No Table
----------------------------------------------
References (17)
- Abreu LM, Da Hora HR, Rangel JJ, Erthal Jr M, Razmjooy N, Estrela VV, Edoh TO, De Oliveira GG, and Iano Y (2020). A multi-criteria modelling for ranking CO2 emitting G20 countries from the Kaya identity and their impacts on elderly health. In: Iano Y, Saotome O, Kemper G, Mendes de Seixas AC, and Gomes de Oliveira G (Eds.), Brazilian technology symposium: 477-487. Volume 233, Springer, Cham, Switzerland. https://doi.org/10.1007/978-3-030-75680-2_53 [Google Scholar]
- Ballesteros HB and Aristizabal GL (2007). Información técnica sobre gases de efecto invernadero y el cambio climático. IDEA-METEO/008-2007, Institute of Hydrology, Meteorology and Environmental Studies-IDEAM, Bogotá, Colombia. [Google Scholar]
- Cordova CH, Portocarrero MN, Salas R, Torres R, Rodrigues PC, and López-Gonzales JL (2021). Air quality assessment and pollution forecasting using artificial neural networks in Metropolitan Lima-Peru. Scientific Reports, 11(1): 24232. https://doi.org/10.1038/s41598-021-03650-9 [Google Scholar] PMid:34930975 PMCid:PMC8688545
- Demoraes F, Ovtracht N, Tabaka K, Duché S, Mericskay B, and Sieper C (2024). The spatial dimension of “pop-up cycle paths” in metropolitan areas a comparative study of France and Colombia. In: Ortar N and Rérat P (Eds.), Cycling through the pandemic. The urban book series: 169-195. Springer International Publishing, Cham, Switzerland. https://doi.org/10.1007/978-3-031-45308-3_8 [Google Scholar]
- Guler D and Yomralioglu T (2021). Location evaluation of bicycle sharing system stations and cycling infrastructures with best worst method using GIS. The Professional Geographer, 73(3): 535-552. https://doi.org/10.1080/00330124.2021.1883446 [Google Scholar]
- Hofmann DJ, Butler JH, Dlugokencky EJ, Elkins JW, Masarie K, Montzka SA, and Tans P (2006). The role of carbon dioxide in climate forcing from 1979 to 2004: Introduction of the annual greenhouse gas index. Tellus B: Chemical and Physical Meteorology, 58(5): 614-619. https://doi.org/10.1111/j.1600-0889.2006.00201.x [Google Scholar]
- Leroutier M and Quirion P (2022). Air pollution and CO2 from daily mobility: Who emits and Why? Evidence from Paris. Energy Economics, 109: 105941. https://doi.org/10.1016/j.eneco.2022.105941 [Google Scholar]
- Luna RM, Soto GB, Oliden DS, and Padilla AB (2021). Bike-sharing management system using IoT. In: Iano Y, Arthur R, Saotome O, Kemper G, and França RP (Eds.), Proceedings of the 5th Brazilian technology symposium: 545-552. Springer International Publishing, Cham, Switzerland. https://doi.org/10.1007/978-3-030-57548-9_52 [Google Scholar]
- Okabe A, Satoh T, and Sugihara K (2009). A kernel density estimation method for networks, its computational method and a GIS‐based tool. International Journal of Geographical Information Science, 23(1): 7-32. https://doi.org/10.1080/13658810802475491 [Google Scholar]
- Pachauri RK and Reisinger A (2007). Climate change 2007: Synthesis report: Contribution of working groups I, II and III to the fourth assessment report of the intergovernmental panel on climate change. Intergovernmental Panel on Climate Change (IPCC), Geneva, Switzerland. [Google Scholar]
- Pinto FST, Fogliatto FS, and Qannari EM (2014). A method for panelists’ consistency assessment in sensory evaluations based on the Cronbach’s alpha coefficient. Food Quality and Preference, 32: 41-47. https://doi.org/10.1016/j.foodqual.2013.06.006 [Google Scholar]
- Pucher J and Dijkstra L (2003). Promoting safe walking and cycling to improve public health: Lessons from the Netherlands and Germany. American Journal of Public Health, 93(9): 1509-1516. https://doi.org/10.2105/AJPH.93.9.1509 [Google Scholar] PMid:12948971 PMCid:PMC1448001
- Semenzato P, Costa A, and Campagnaro T (2023). Accessibility to urban parks: Comparing GIS based measures in the city of Padova (Italy). Urban Forestry and Urban Greening, 82: 127896. https://doi.org/10.1016/j.ufug.2023.127896 [Google Scholar]
- Subils MJB and Domínguez FB (2000). NTP 549: El dióxido de carbono en la evaluación de la calidad del aire interior. Ministerio de Trabajo y Asuntos Sociales de España, Madrid, Spain. [Google Scholar]
- Venkatesan P (2016). WHO report: Air pollution is a major threat to health. The Lancet Respiratory Medicine, 4(5): 351. https://doi.org/10.1016/S2213-2600(16)30014-5 [Google Scholar] PMid:27012457
- Weart S (2013). The discovery of global warming. Harvard University Press, Cambridge, USA. [Google Scholar]
- Yucra FR (2017). Determinación del nivel de contaminación de dioxido de carbono por parque automotor en la ciudad de Puno. Acceso Libre a Información Científica para la Innovación (ALICIA), San Isidro, Peru. [Google Scholar]