
International
ADVANCED AND APPLIED SCIENCES
EISSN: 2313-3724, Print ISSN: 2313-626X
Frequency: 12
![]()
Volume 11, Issue 3 (March 2024), Pages: 226-237

----------------------------------------------
Original Research Paper
Enhancing handicraft exports in West Java: A business intelligence approach to market expansion
Author(s):
Affiliation(s):
1Faculty of Economics and Business, Universitas Widyatama, Bandung, Indonesia
2Department of Computer Engineering and Informatics, Politeknik Negeri Bandung, Bandung, Indonesia
Full text

* Corresponding Author.
 Corresponding author's ORCID profile: https://orcid.org/0000-0001-5277-1411
Digital Object Identifier (DOI)
https://doi.org/10.21833/ijaas.2024.03.022
Abstract
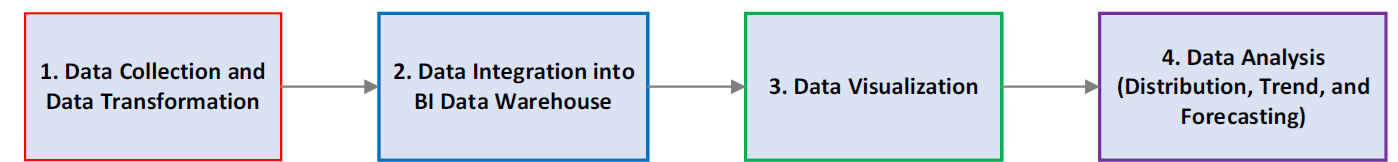
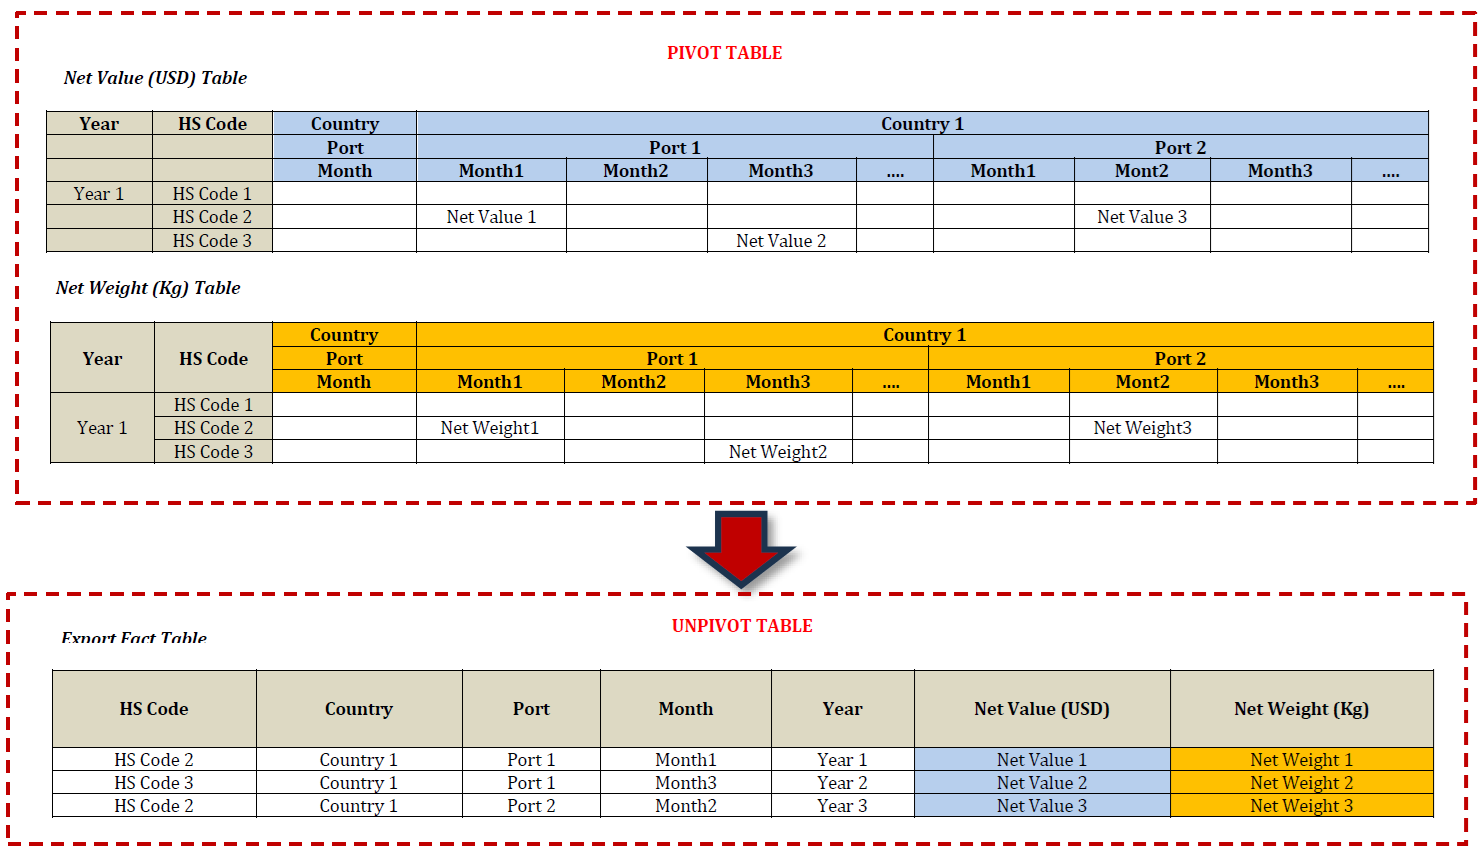
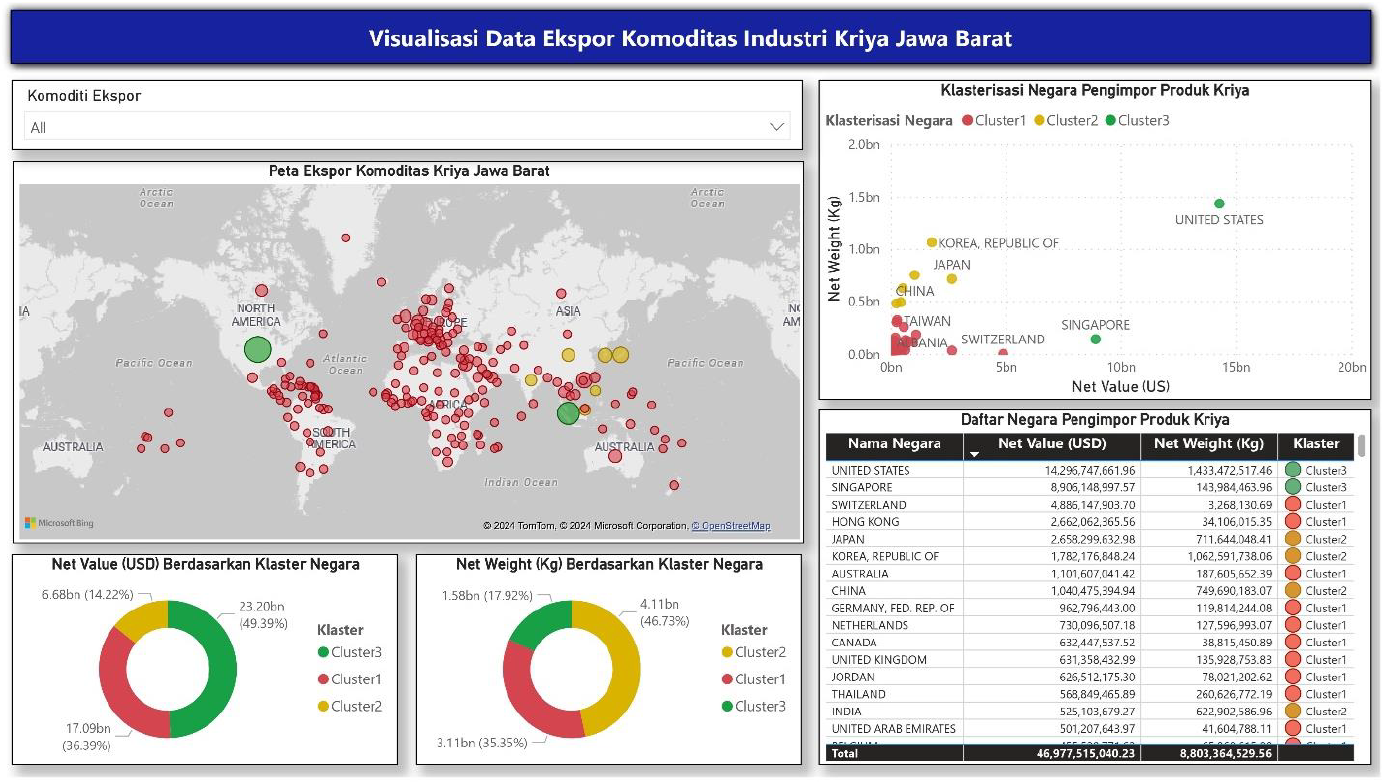
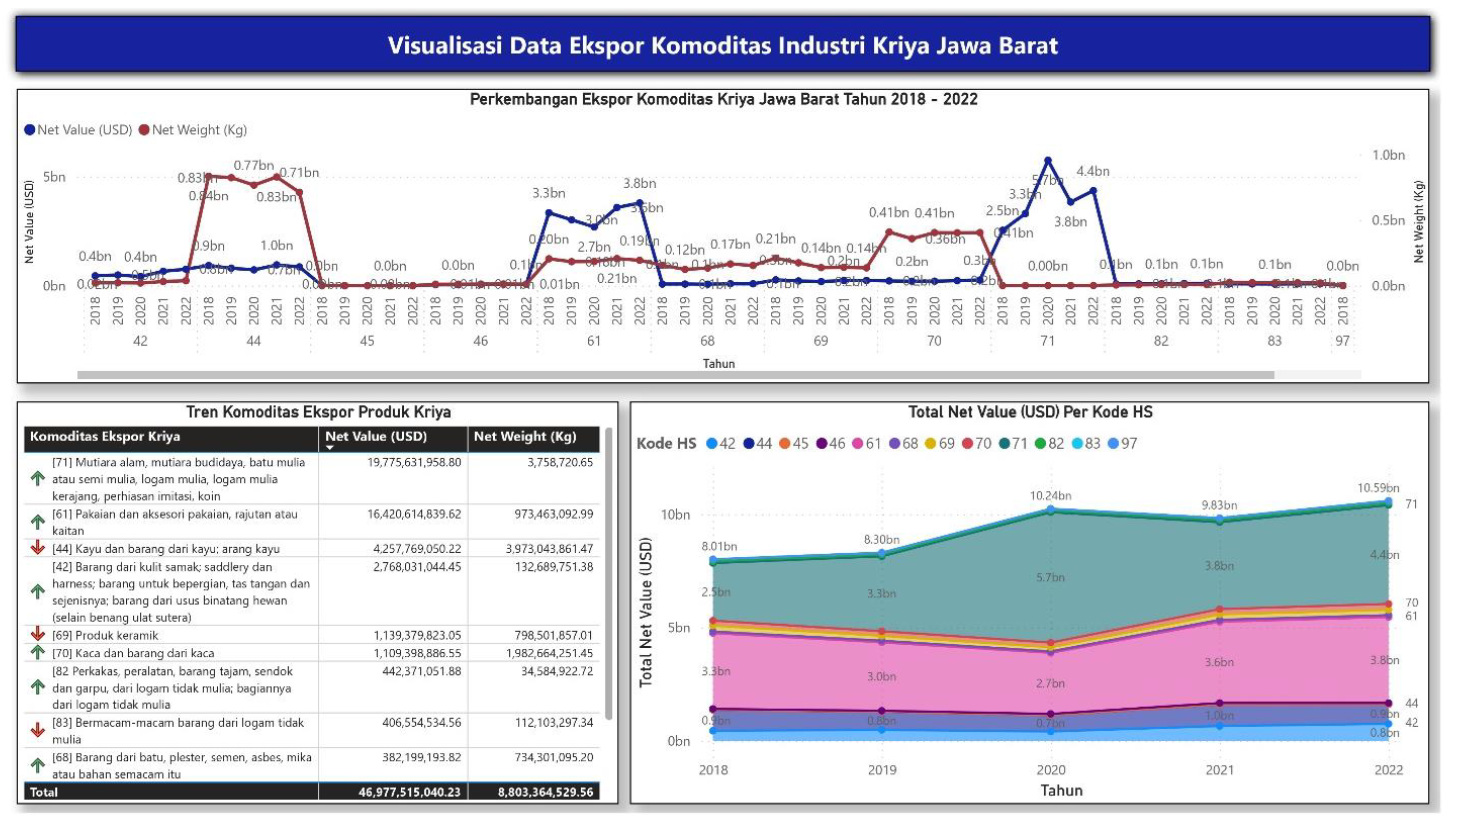
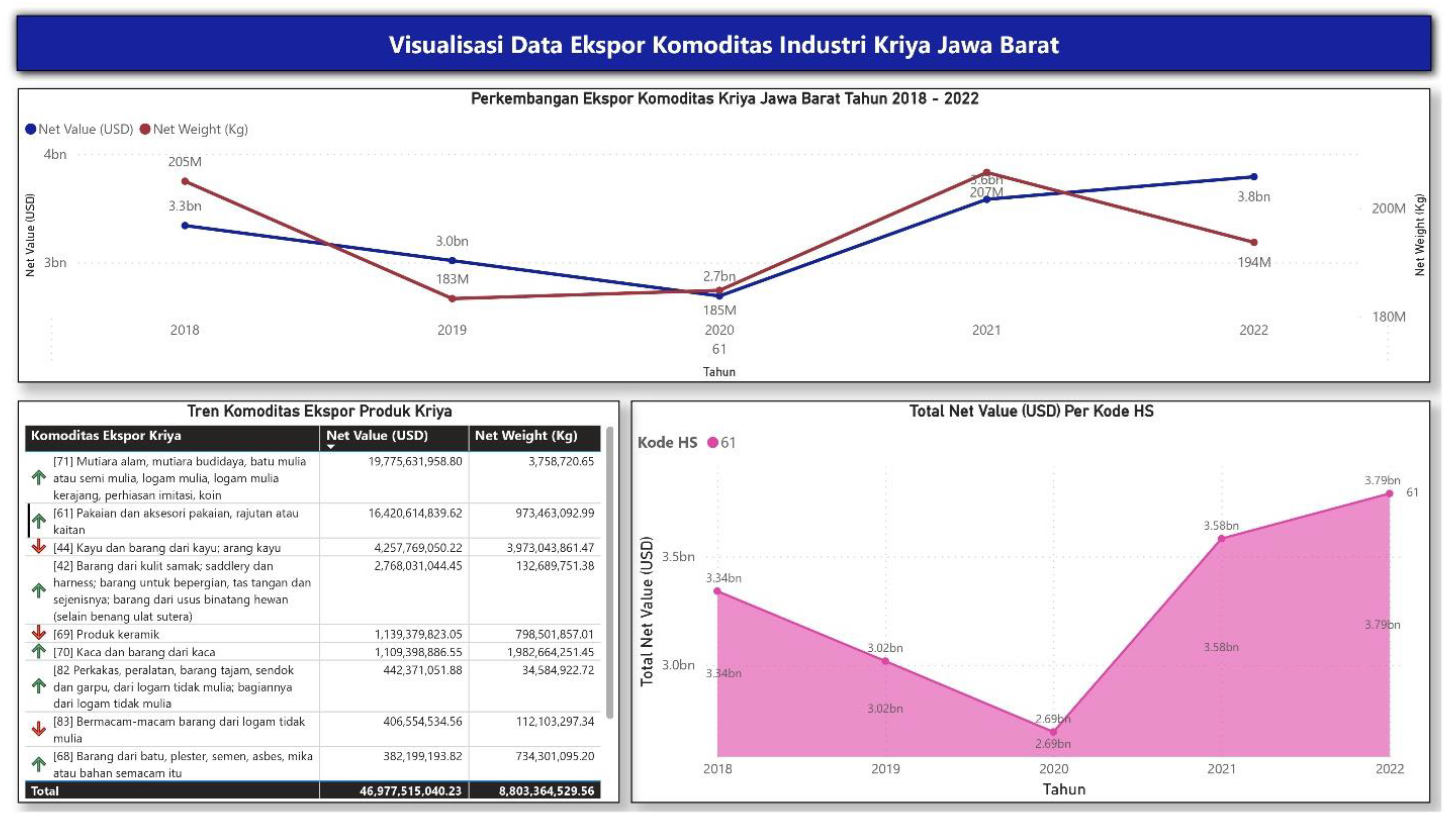
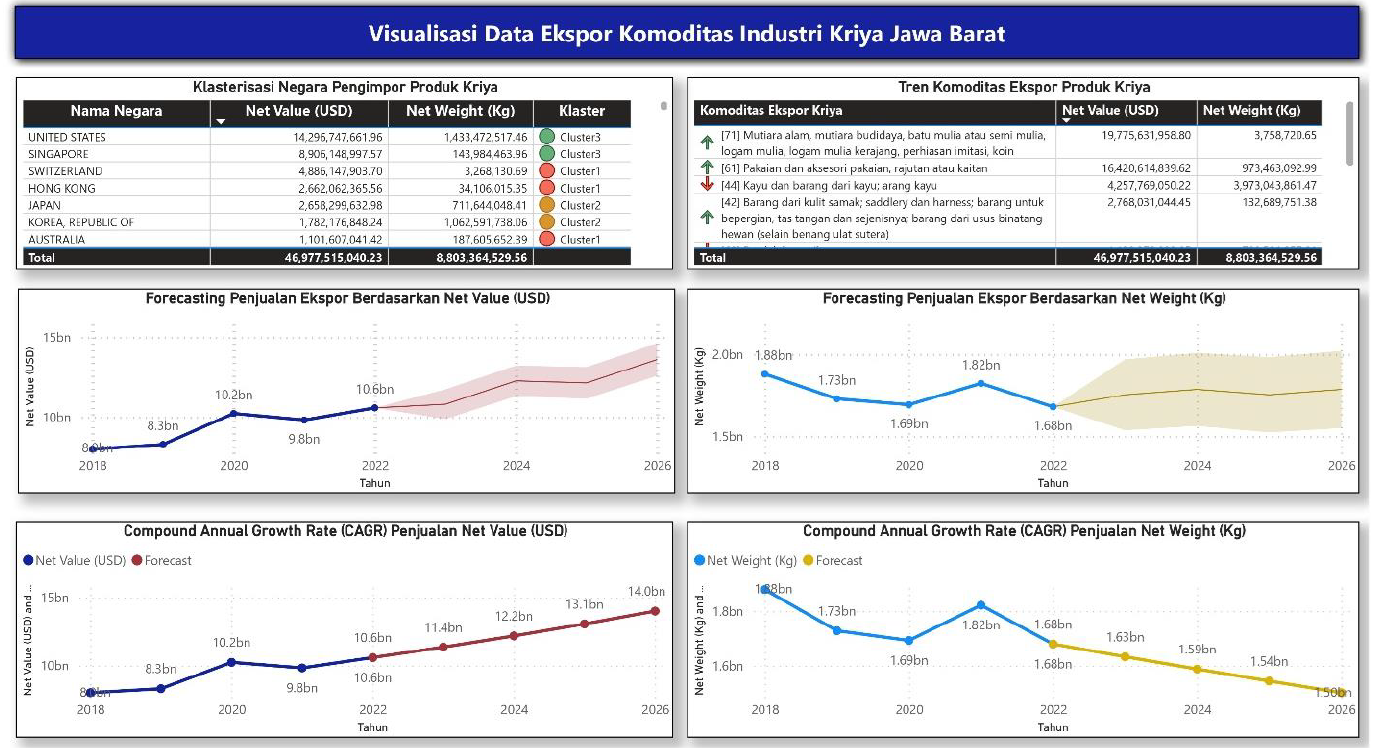
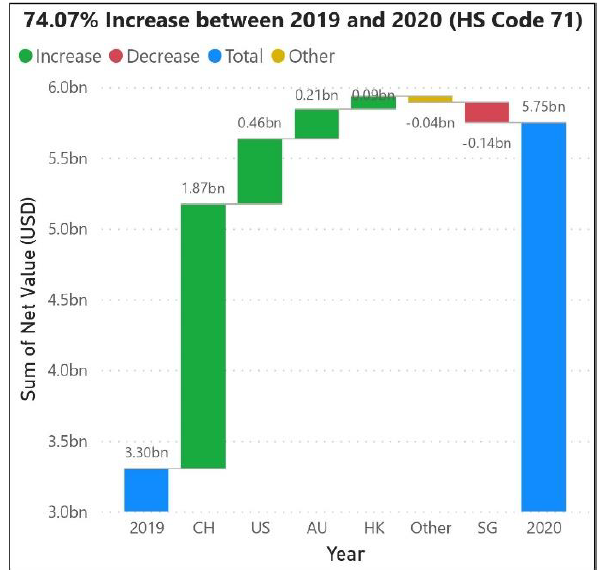
The creative industries in West Java have significantly boosted the region's economy, contributing to higher GDP, more jobs, and increased exports. However, the handicraft sector seeks to grow its presence in the international market, where it currently holds a minor share. To address the challenges of expanding, such as limited information, marketing obstacles, and regulatory hurdles, the handicraft industry is encouraged to adopt a business intelligence (BI) platform. This study aims to use a BI platform to present and analyze export data for West Java's craft industry, examining its distribution, trends, and future prospects to help increase exports from this Indonesian province. The analysis employs clustering with k-means, time series analysis, and forecasting methods, including exponential smoothing and the compound annual growth rate (CAGR), using export data from 2018 to 2022. The process involves collecting primary and secondary data, transforming it through ETL (Extract, Transform, Load) technology, and integrating it into the BI platform for analysis. This analysis aims to identify export patterns, trends, and make forecasts that can guide decision-making. The findings indicate that handicraft exports are categorized into three destination country clusters, each favoring different product types, revealing trends and growth opportunities for various handicraft items. Additionally, the study provides forecasts for handicraft exports, offering valuable insights for strategic planning.
© 2024 The Authors. Published by IASE.
This is an
Keywords
Business intelligence platform, Handicraft export trends, West Java economy, Data analysis methods, Export strategy development
Article history
Received 17 October 2023, Received in revised form 9 March 2024, Accepted 10 March 2024
Acknowledgment
The authors would like to thank the Ministry of Education, Culture, Research and Technology Directorate of Research, Technology and Community Service, Directorate General of Higher Education, Research and Technology of the Republic of Indonesia for funding this research through the Research Contract Project Number: 074/E5/PG.02.00.PL/2023, 18 April 2023.
Compliance with ethical standards
Conflict of interest: The author(s) declared no potential conflicts of interest with respect to the research, authorship, and/or publication of this article.
Citation:
Munawar F, Munawar G, and Tarmidi D (2024). Enhancing handicraft exports in West Java: A business intelligence approach to market expansion. International Journal of Advanced and Applied Sciences, 11(3): 226-237
Figures
Fig. 1 Fig. 2 Fig. 3 Fig. 4 Fig. 5 Fig. 6 Fig. 7 Fig. 8 Fig. 9
Tables
----------------------------------------------
References (35)
- Aghabozorgi S, Seyed Shirkhorshidi A, and Ying Wah T (2015). Time-series clustering-A decade review. Information Systems, 53: 16–38. https://doi.org/10.1016/j.is.2015.04.007 [Google Scholar]
- Atem F, Ngwa JS, and Adeniji A (2012). Regression models for mixed over-dispersed poisson and continuous clustered data: Modeling BMI and number of cigarettes smoked per day. Journal of Modern Applied Statistical Methods, 11(1): 218–232. https://doi.org/10.22237/jmasm/1335845880 [Google Scholar]
- Becker LT and Gould EM (2019). Microsoft power BI: Extending Excel to manipulate, analyze, and visualize diverse data. Serials Review, 45(3): 184–188. https://doi.org/10.1080/00987913.2019.1644891 [Google Scholar]
- Bohm K, Smidt E, and Tintner J (2013). Application of multivariate data analyses in waste management. In: Freitas L and De Freitas APBR (Eds.), Multivariate analysis in management, engineering and the sciences: 15-38. BoD–Books on Demand, Norderstedt, Germany. https://doi.org/10.5772/53975 [Google Scholar]
- Bustamante A, Sebastia L, and Onaindia E (2020). BITOUR: A business intelligence platform for tourism analysis. ISPRS International Journal of Geo-Information, 9(11): 671. https://doi.org/10.3390/ijgi9110671 [Google Scholar]
- Dong Y (2022). Optimization and analysis of raw material supply chain based on computational intelligence. Mobile Information Systems, 2022: 8683598. https://doi.org/10.1155/2022/8683598 [Google Scholar]
- Ferbar Tratar L, Mojškerc B, and Toman A (2016). Demand forecasting with four-parameter exponential smoothing. International Journal of Production Economics, 181: 162–173. https://doi.org/10.1016/j.ijpe.2016.08.004 [Google Scholar]
- FHAN (2015). Export statistics. Federation of Handicraft Associations of Nepal (FHAN), Kathmandu, Nepal.
- Halperin S and Heath O (2020). Political research: Methods and practical skills. Oxford University Press, USA. https://doi.org/10.1093/hepl/9780198820628.001.0001 [Google Scholar]
- Hyndman RJ and Athanasopoulos G (2013). Forecasting: Principles and practice. OTexts, Melbourne, Australia. [Google Scholar]
- Iqbal MZ, Mustafa G, Sarwar N, Wajid SH, Nasir J, and Siddque S (2020). A review of star schema and snowflakes schema. Communications in Computer and Information Science, 1198: 129–140. https://doi.org/10.1007/978-981-15-5232-8_12 [Google Scholar]
- Jolly J (2023). Develop a data model. In: Jolly J (Ed.), Microsoft power BI data analyst certification companion: Preparation for exam PL-300: 125–151. Apress, Berkeley, USA. https://doi.org/10.1007/978-1-4842-9013-2_6 [Google Scholar]
- Kılıç DK and Uğur Ö (2018). Multiresolution analysis of S&P500 time series. Annals of Operations Research, 260(1-2): 197-216. https://doi.org/10.1007/s10479-016-2215-3 [Google Scholar]
- Maçaira PM, Tavares Thomé AM, Cyrino Oliveira FL, and Carvalho Ferrer AL (2018). Time series analysis with explanatory variables: A systematic literature review. Environmental Modelling and Software, 107: 199–209. https://doi.org/10.1016/j.envsoft.2018.06.004 [Google Scholar]
- Moraffah R, Sheth P, Karami M, Bhattacharya A, Wang Q, Tahir A, Raglin A, and Liu H (2021). Causal inference for time series analysis: Problems, methods and evaluation. Knowledge and Information Systems, 63(12): 3041–3085. https://doi.org/10.1007/s10115-021-01621-0 [Google Scholar]
- Morissette L and Chartier S (2013). The k-means clustering technique: General considerations and implementation in Mathematica. Tutorials in Quantitative Methods for Psychology, 9(1): 15–24. https://doi.org/10.20982/tqmp.09.1.p015 [Google Scholar]
- Munawar F, Munawar G, Tarmidi D, and Munawar R (2022). Developing business intelligence model in creative craft industry to support acceleration of the craft exporter industry in West Java. Res Militaris, 12(2): 2924–2937. [Google Scholar]
- Munawar F, Rahayu A, Disman D, and Wibowo LA (2019). Management commitment and export performance of creative industry: The mediating role of partner relationship program. International Journal of Innovation, Creativity and Change, 6: 1-22. [Google Scholar]
- Munawar G and Munawar F (2023). Business intelligence framework for mapping analysis of crafts creative industry products exports in west java, Indonesia. KnE Social Sciences, 8(12): 792–802. https://doi.org/10.18502/kss.v8i12.13725 [Google Scholar]
- Neubert M and Van der Krogt A (2018). Impact of business intelligence solutions on export performance of software firms in emerging economies. Technology Innovation Management Review, 8(9): 39-49. https://doi.org/10.22215/timreview/1185 [Google Scholar]
- Nirmala VW, Harjadi D, and Awaluddin R (2021). Sales forecasting by using exponential smoothing method and trend method to optimize product sales in PT. Zamrud Bumi Indonesia during the Covid-19 pandemic. International Journal of Engineering, Science and Information Technology, 1(4): 59-64. https://doi.org/10.52088/ijesty.v1i4.169 [Google Scholar]
- Pan B, Zhang G, and Qin X (2018). Design and realization of an ETL method in business intelligence project. In the 2018 IEEE 3rd International Conference on Cloud Computing and Big Data Analysis (ICCCBDA), IEEE, Chengdu, China: 275-279. https://doi.org/10.1109/ICCCBDA.2018.8386526 [Google Scholar]
- Prasad GVSCSLV, Lakshmi Reddy MSR, Babu Rao K, and Suresh Kumar C (2020). Approach for developing business statistics using data web usage mining. International Journal of Recent Advances in Engineering and Technology, 8(2): 1–13. https://doi.org/10.46564/ijraet.2020.v08i02.001 [Google Scholar]
- Putra AR, Ernawati E, Jahroni J, Anjanarko TS, and Retnowati E (2022). Creative economy development efforts in culinary business. Journal of Social Science Studies, 2(1): 21–26. https://doi.org/10.56348/jos3.v2i1.17 [Google Scholar]
- Rajeswari M (2020). A study on construction of an investment portfolio using fundamental analysis. International Journal of Management, 11(12): 415-429. https://doi.org/10.34218/IJM.11.12.2020.038 [Google Scholar]
- Saleh R (2022). Creative economy development toward stability of national economy (Indonesia). Journal Research of Social, Science, Economics, and Management, 1(7): 809–817. https://doi.org/10.36418/jrssem.v1i7.110 [Google Scholar]
- Sebastiani P and Perls TT (2016). Detection of significant groups in hierarchical clustering by resampling. Frontiers in Genetics, 7: 144. https://doi.org/10.3389/fgene.2016.00144 [Google Scholar] PMid:27551289 PMCid:PMC4976109
- Shah S, Akbar M, and Raza U (2021). A review on anomaly detection in time series. International Journal of Advanced Trends in Computer Science and Engineering, 10(3): 1895–1900. https://doi.org/10.30534/ijatcse/2021/571032021 [Google Scholar]
- Sharma SK and Sharma GK (2015). Demand forecasting technique vis-à-vis demand forecasting for lead. Procedia Earth and Planetary Science, 11: 418–424. https://doi.org/10.1016/j.proeps.2015.06.041 [Google Scholar]
- Shastri S, Sharma A, Mansotra V, Sharma A, Bhadwal A, and Kumari M (2018). A study on exponential smoothing method for forecasting. International Journal of Computer Sciences and Engineering, 6(4): 482–485. https://doi.org/10.26438/ijcse/v6i4.482485 [Google Scholar]
- Sufi F, Alam E, and Alsulami M (2022). Automated analysis of Australian tropical cyclones with regression, clustering and convolutional neural network. Sustainability, 14(16): 9830. https://doi.org/10.3390/su14169830 [Google Scholar]
- Van Genuchten M and Hatton L (2012). Compound annual growth rate for software. IEEE Software, 29(4): 19–21. https://doi.org/10.1109/MS.2012.79 [Google Scholar]
- Vijayalakshmi P and Sathishkumar R (2018). Investment pattern of life insurance corporation of India. International Journal for Science and Advance Research in Technology, 4(8): 451-457. [Google Scholar]
- Williams S (2016). Business intelligence strategy and big data analytics: A general management perspective. Morgan Kaufmann Publishers, Burlington, USA. https://doi.org/10.1016/B978-0-12-809198-2.00008-7 [Google Scholar]
- Zhou W (2021). K-means clustering algorithm analysis on specific economic development problems in target countries. In the 2nd International Conference on Computer Science and Management Technology (ICCSMT), Shanghai, China: 396–402. https://doi.org/10.1109/ICCSMT54525.2021.00078 [Google Scholar]