
International
ADVANCED AND APPLIED SCIENCES
EISSN: 2313-3724, Print ISSN: 2313-626X
Frequency: 12
![]()
Volume 10, Issue 8 (August 2023), Pages: 106-111

----------------------------------------------
Original Research Paper
Application of supervised learning algorithm to determine the quality of slippers in WEKA
Author(s):
Jennilyn C. Mina *
Affiliation(s):
College of Management and Business Technology, Nueva Ecija University of Science and Technology, Cabanatuan City, Philippines

* Corresponding Author.
 Corresponding author's ORCID profile: https://orcid.org/0000-0002-7835-6045
Digital Object Identifier:
https://doi.org/10.21833/ijaas.2023.08.012
Abstract:
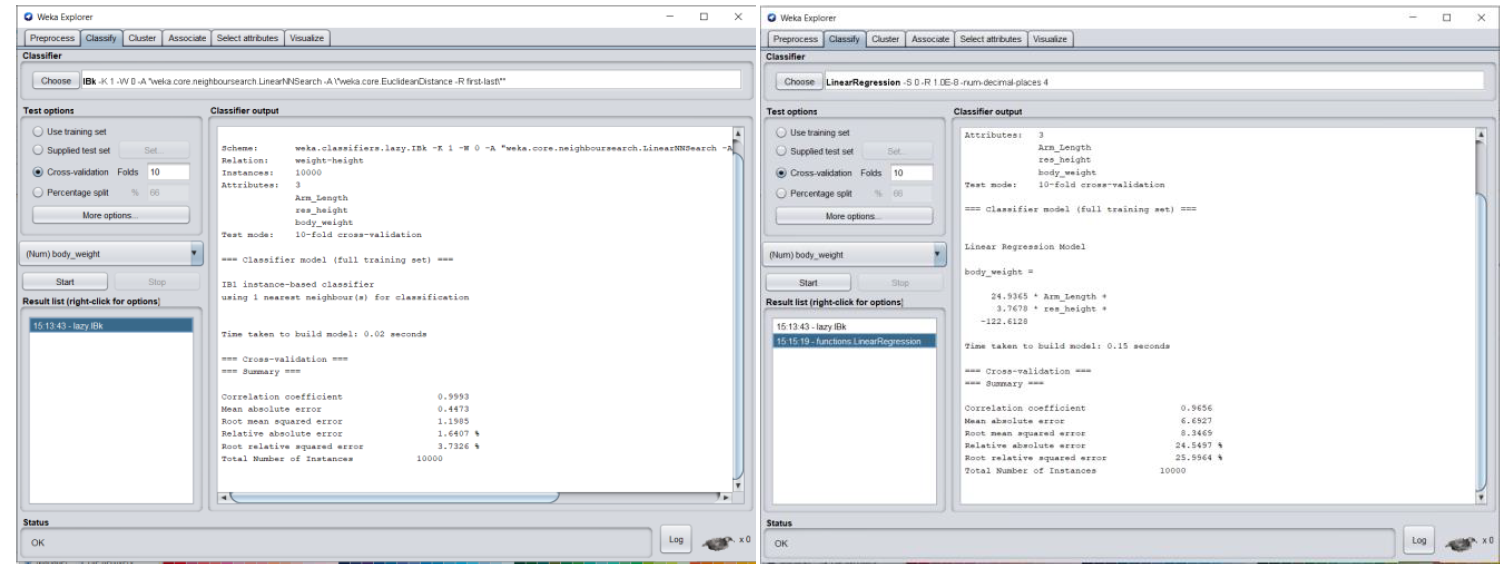
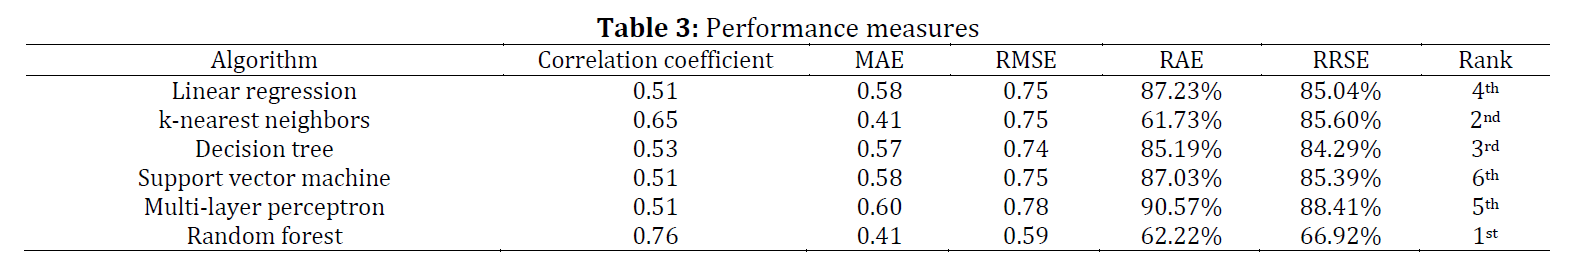
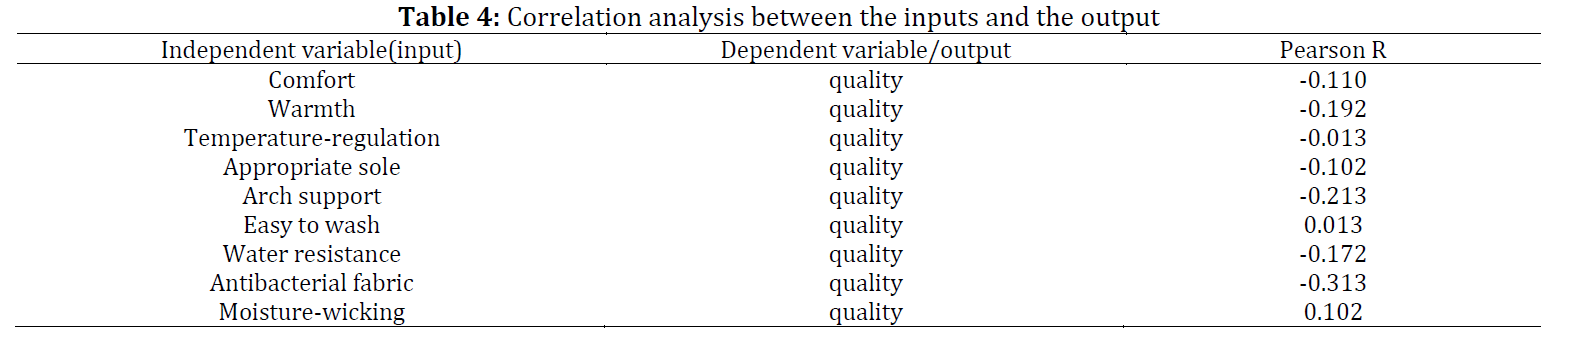
This study is driven by the objective of evaluating the effectiveness of various regression algorithms in the prediction of slipper quality. The selected regression algorithms were implemented within the Waikato Environment for Knowledge Analysis. The assessment of their performance was conducted through the analysis of correlation coefficients, providing insights into their predictive capabilities. Notably, the Random Forest algorithm demonstrated the highest predictive power with an impressive correlation coefficient (r=0.76), surpassing other models in the analysis. Following Random Forest, the k-nearest neighbor algorithm achieved a substantial correlation coefficient of (r=0.65), followed by the Decision Tree (r=0.53), Linear regression (r=0.51), and the Multi-layer perceptron (r=0.51). In contrast, the Support Vector Machine showed a notably lower correlation coefficient (r=0.51), indicating its comparatively weaker predictive performance. Furthermore, this study uncovered two variables, "Easy to Wash" and "Water Resistance," which displayed significant correlations of (r=0.49) and (r=-0.35), respectively, in relation to the predictive performance of the regression model. However, no significant correlation was observed for other variables. In light of these findings, future research endeavors may explore alternative predictive models to further assess and compare their performance against the outcomes presented in this study, contributing to the ongoing enhancement of slipper quality prediction methodologies.
© 2023 The Authors. Published by IASE.
This is an
Keywords: Decision tree, K-nearest neighbor, Linear regression, Multi-layer perceptron, Random forest, Support vector machine
Article History: Received 17 January 2023, Received in revised form 15 June 2023, Accepted 6 July 2023
Acknowledgment
No Acknowledgment.
Compliance with ethical standards
Ethical consideration:
All processes used to analyze data sets from a specific source complied with ethical guidelines. The data sources are properly credited and listed in the reference section.
Conflict of interest: The author(s) declared no potential conflicts of interest with respect to the research, authorship, and/or publication of this article.
Citation:
Mina JC (2023). Application of supervised learning algorithm to determine the quality of slippers in WEKA. International Journal of Advanced and Applied Sciences, 10(8): 106-111
Figures
Tables
Table 1 Table 2 Table 3 Table 4
----------------------------------------------
References (17)
- Asuncion A and Newman D (2007). UCI machine learning repository. Available online at: https://archive.ics.uci.edu/
- Beltrán NH, Duarte-Mermoud MA, Vicencio VAS, Salah SA, and Bustos MA (2008). Chilean wine classification using volatile organic compounds data obtained with a fast GC analyzer. IEEE Transactions on Instrumentation and Measurement, 57(11): 2421-2436. https://doi.org/10.1109/TIM.2008.925015 [Google Scholar]
- Buccola ST and VanderZanden L (1997). Wine demand, price strategy, and tax policy. Applied Economic Perspectives and Policy, 19(2): 428-440. https://doi.org/10.2307/1349750 [Google Scholar]
- Cortez P, Cerdeira A, Almeida F, Matos T, and Reis J (2009). Modeling wine preferences by data mining from physicochemical properties. Decision Support Systems, 47(4): 547-553. https://doi.org/10.1016/j.dss.2009.05.016 [Google Scholar]
- Er Y and Atasoy A (2016). The classification of white wine and red wine according to their physicochemical qualities. International Journal of Intelligent Systems and Applications in Engineering, 4(Special Issue-1): 23-26. https://doi.org/10.18201/ijisae.265954 [Google Scholar]
- Frank E, Hall M, Holmes G, Kirkby R, Pfahringer B, Witten IH, and Trigg L (2010). WEKA-A machine learning workbench for data mining. In: Maimon O and Rokach L (Eds.), Data Mining and Knowledge Discovery Handbook. Springer, Boston, USA. https://doi.org/10.1007/978-0-387-09823-4_66 [Google Scholar]
- Gupta Y (2018). Selection of important features and predicting wine quality using machine learning techniques. Procedia Computer Science, 125: 305-312. https://doi.org/10.1016/j.procs.2017.12.041 [Google Scholar]
- Gutiérrez AJ, Rubio C, Moreno IM, González AG, Gonzalez-Weller D, Bencharki N, and Revert C (2017). Estimation of dietary intake and target hazard quotients for metals by consumption of wines from the Canary Islands. Food and Chemical Toxicology, 108: 10-18. https://doi.org/10.1016/j.fct.2017.07.033 [Google Scholar] PMid:28733233
- Holmes G, Donkin A, and Witten IH (1994). WEKA: A machine learning workbench. In Proceedings of ANZIIS'94-Australian New Zealand Intelligent Information Systems Conference, IEEE, Brisbane, Australia: 357-361. https://doi.org/10.1109/ANZIIS.1994.396988 [Google Scholar]
- Khalafyan AA, Temerdashev ZA, Akin'shina VA, and Yakuba YF (2021). Data on the sensory evaluation of the dry red and white wines quality obtained by traditional technologies from European and hybrid grape varieties in the Krasnodar Territory, Russia. Data in Brief, 36: 106992. https://doi.org/10.1016/j.dib.2021.106992 [Google Scholar] PMid:33889695 PMCid:PMC8050733
- Kumar S, Agrawal K, and Mandan N (2020). Red wine quality prediction using machine learning techniques. In the International Conference on Computer Communication and Informatics, IEEE, Coimbatore, India: 1-6. https://doi.org/10.1109/ICCCI48352.2020.9104095 [Google Scholar]
- Legin A, Rudnitskaya A, Lvova L, Vlasov Y, Di Natale C, and D’amico A (2003). Evaluation of Italian wine by the electronic tongue: Recognition, quantitative analysis and correlation with human sensory perception. Analytica Chimica Acta, 484(1): 33-44. https://doi.org/10.1016/S0003-2670(03)00301-5 [Google Scholar]
- McClendon L and Meghanathan N (2015). Using machine learning algorithms to analyze crime data. Machine Learning and Applications: An International Journal, 2(1): 1-12. https://doi.org/10.5121/mlaij.2015.2101 [Google Scholar]
- Smith DV and Margolskee RF (2006). Making sense of taste. Scientific American, 16(3): 84-92. https://doi.org/10.1038/scientificamerican0906-84sp [Google Scholar]
- Sun LX, Danzer K, and Thiel G (1997). Classification of wine samples by means of artificial neural networks and discrimination analytical methods. Fresenius' Journal of Analytical Chemistry, 359: 143-149. https://doi.org/10.1007/s002160050551 [Google Scholar]
- Vlassides S, Ferrier JG, and Block DE (2001). Using historical data for bioprocess optimization: Modeling wine characteristics using artificial neural networks and archived process information. Biotechnology and Bioengineering, 73(1): 55-68. https://doi.org/10.1002/1097-0290(20010405)73:1<55::AID-BIT1036>3.0.CO;2-5 [Google Scholar] PMid:11255152
- Yu H, Lin H, Xu H, Ying Y, Li B, and Pan X (2008). Prediction of enological parameters and discrimination of rice wine age using least-squares support vector machines and near infrared spectroscopy. Journal of Agricultural and Food Chemistry, 56(2): 307-313. https://doi.org/10.1021/jf0725575 [Google Scholar] PMid:18167072