
International
ADVANCED AND APPLIED SCIENCES
EISSN: 2313-3724, Print ISSN: 2313-626X
Frequency: 12
![]()
Volume 8, Issue 8 (August 2021), Pages: 31-35

----------------------------------------------
Original Research Paper
Title: The utility of concentration duration curve in CH4 and CO2 risk assessment
Author(s): Arthur Nwachukwu Nwachukwu 1, 2, *, Eluwa Ndidiamaka Nchedo 2, Godswill Abam Eyong 3, Nwagu Kingsley Ekenechukwu 4, Olaosebikan Oluwatosin Oluwatoyin 4, Uzoh Chukwuma Victor 4, Okpaga Fredrick Ogeh 4
Affiliation(s):
1Williamson Research Centre for Molecular Environmental Sciences School of Earth, Atmospheric and Environmental Sciences, University of Manchester, Manchester, UK
2Department of Physics, Faculty of Science, Alex Ekwueme Federal University, Ndufu-Alike Ikwo, Nigeria
3Department of Geology, Faculty of Physical Sciences, University of Calabar, Calabar, Nigeria
4Department of Biology/Microbiology/Biotechnology, Alex Ekwueme Federal University, Ndufu-Alike Ikwo, Nigeria

* Corresponding Author.
 Corresponding author's ORCID profile: https://orcid.org/0000-0003-0852-9745
Digital Object Identifier:
https://doi.org/10.21833/ijaas.2021.08.004
Abstract:
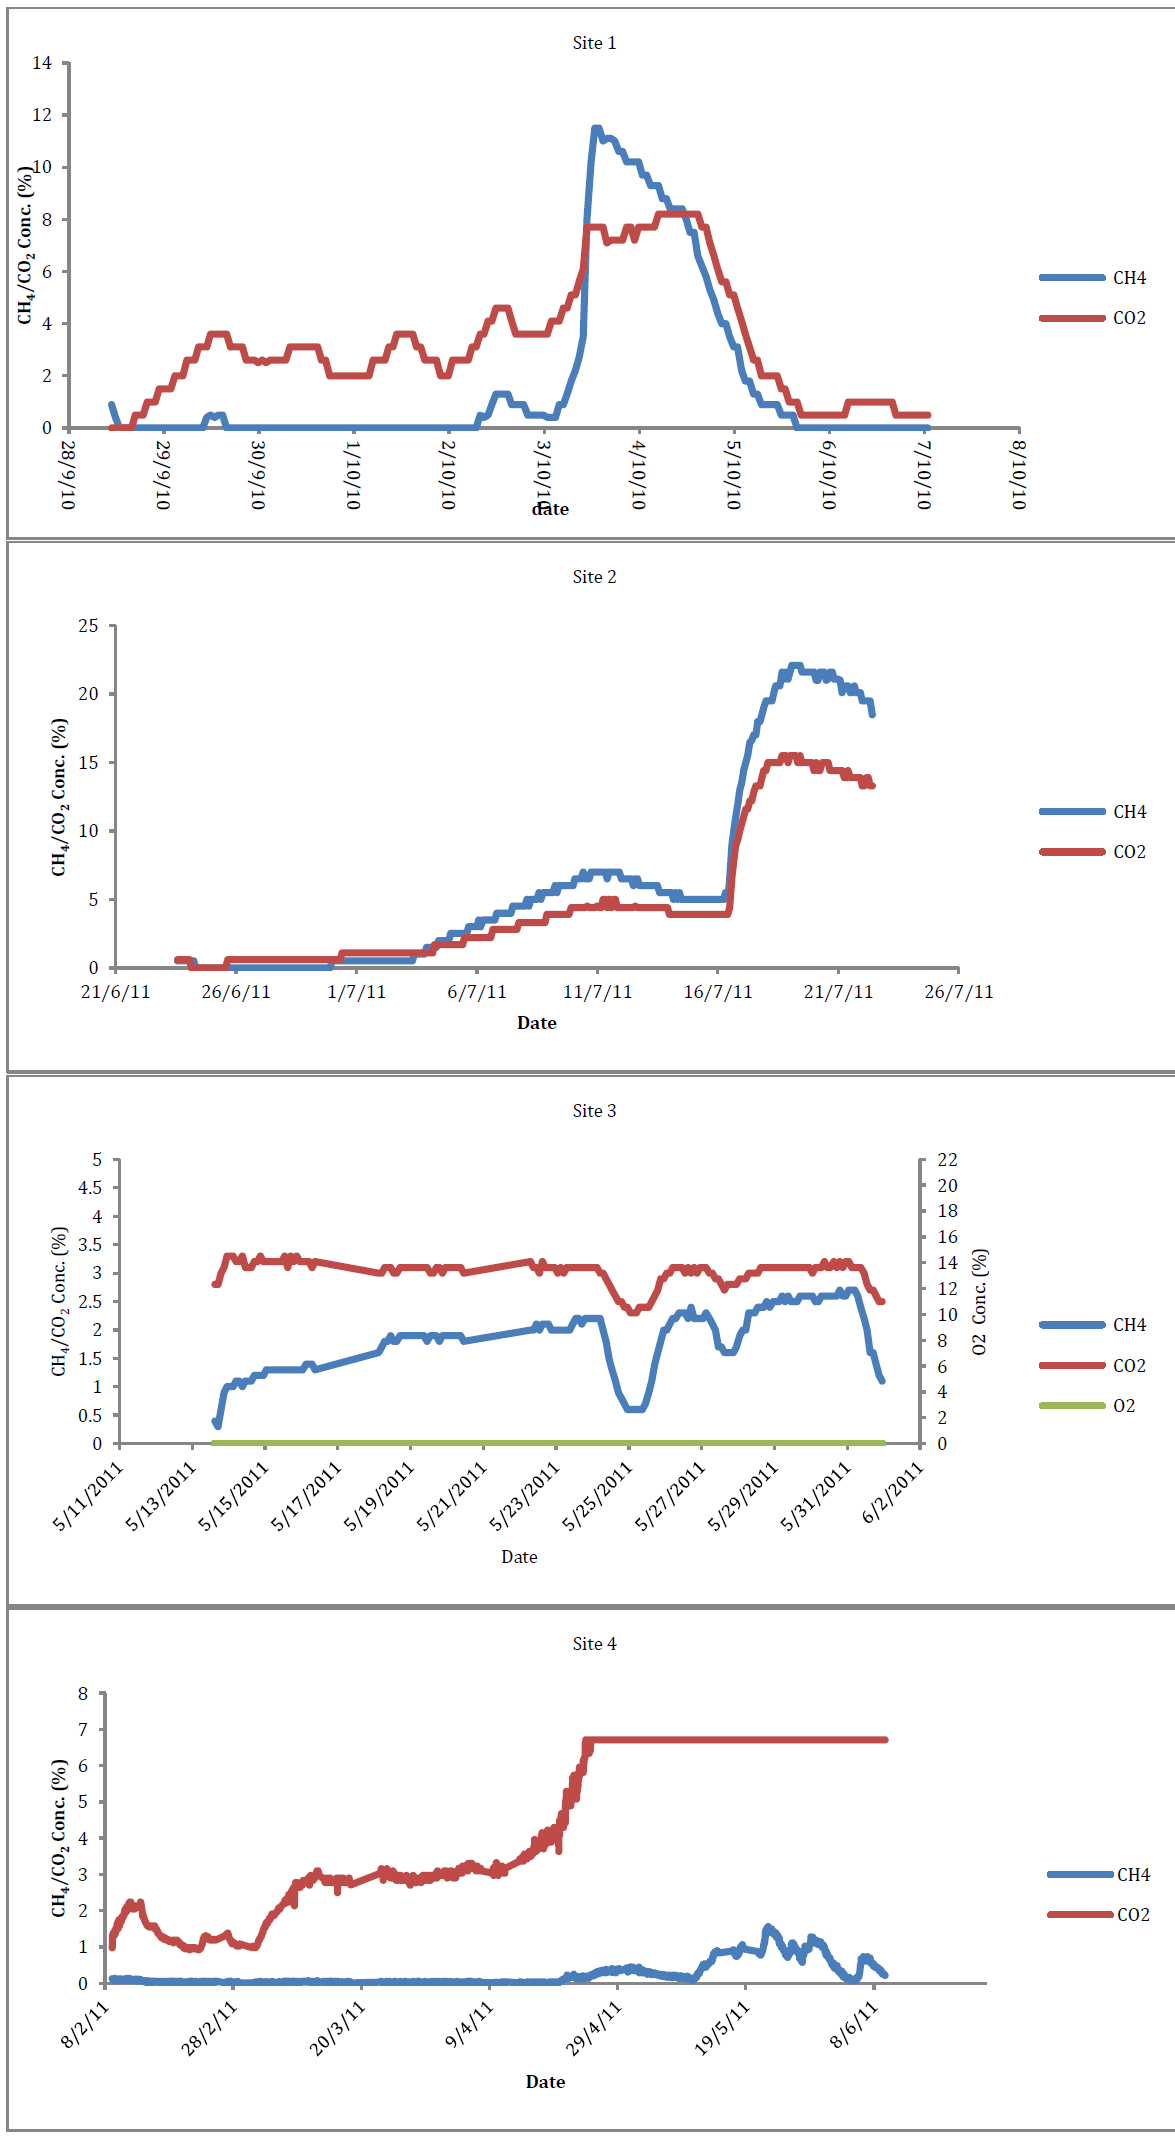
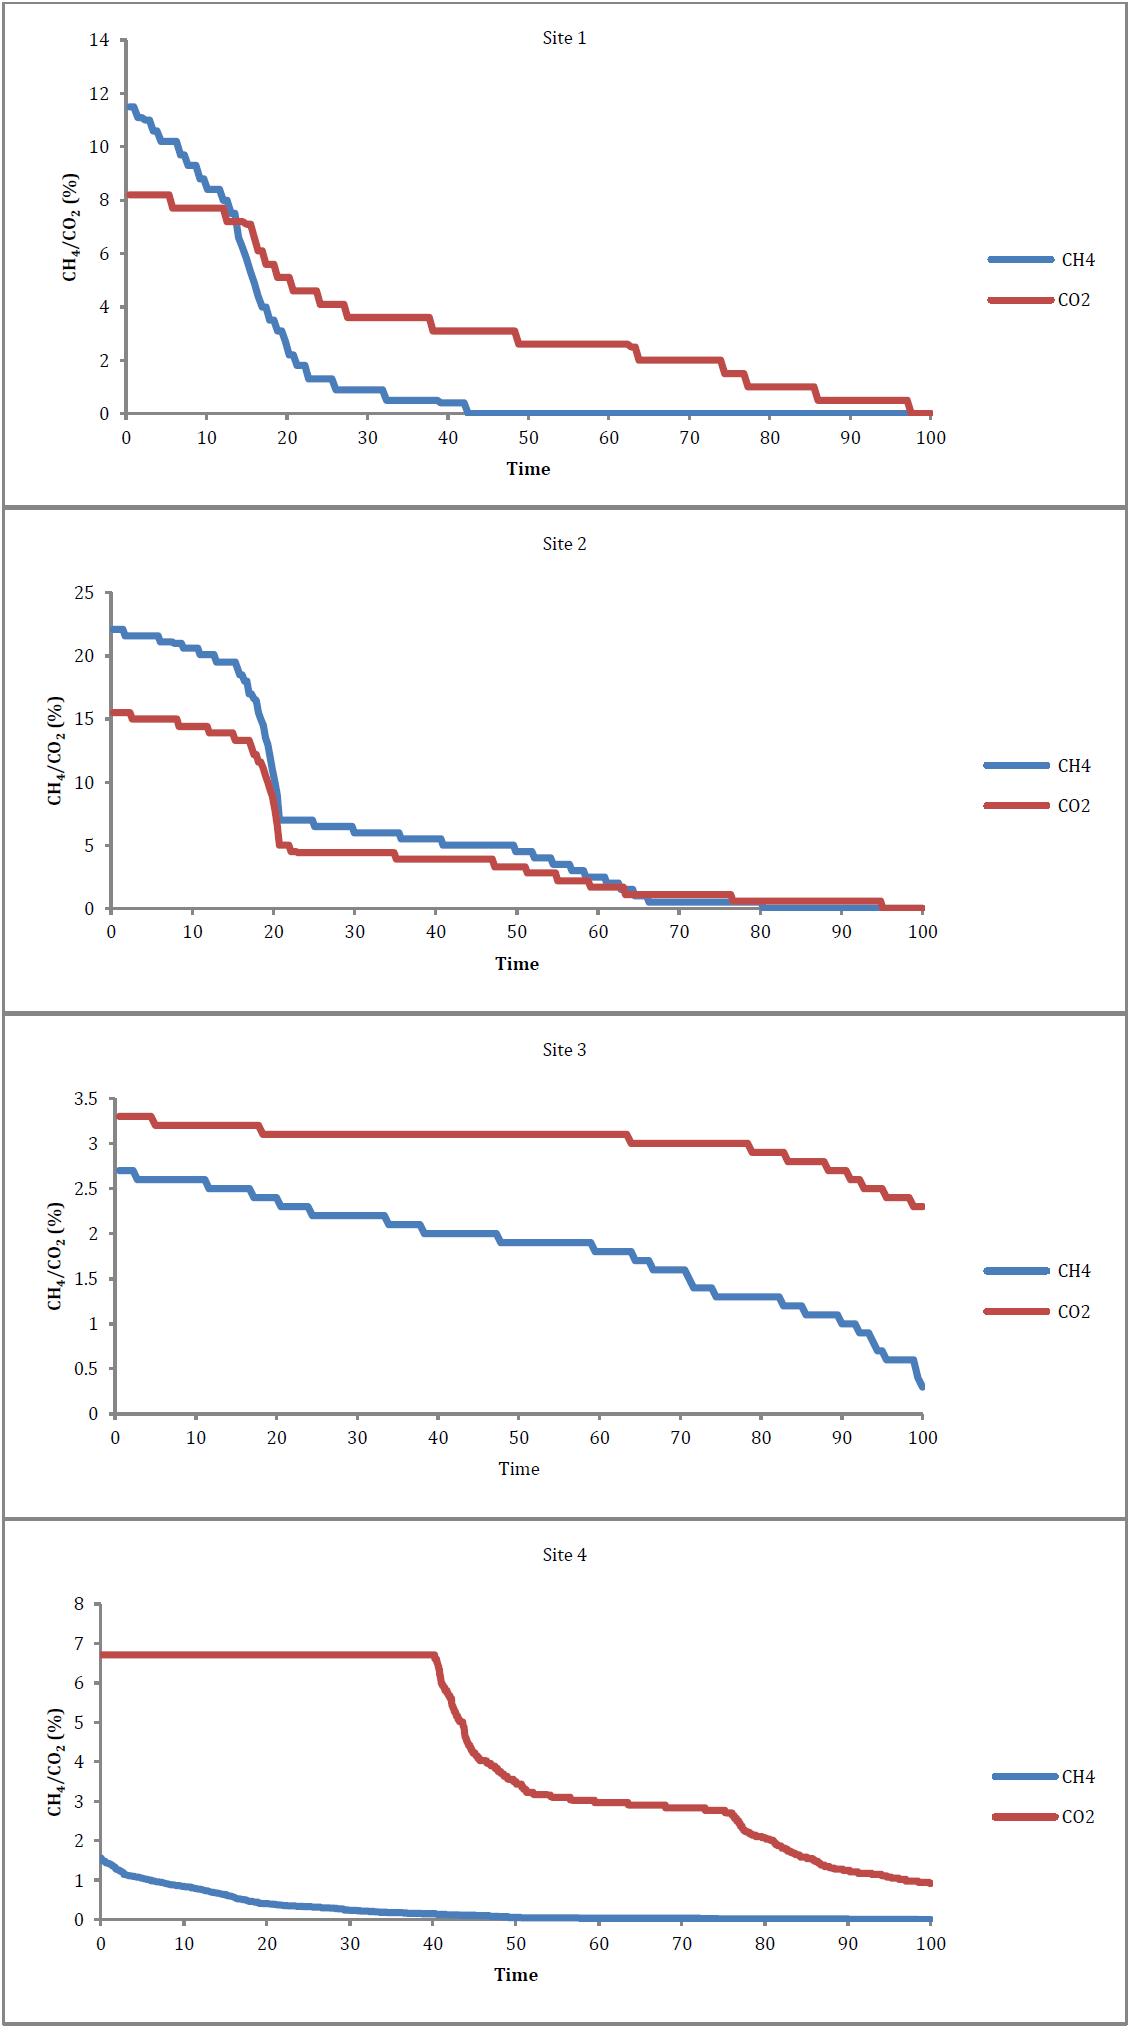
Current CH4 and CO2 risk assessment of comparing the single occurrence of worst-case concentration with trigger values of 5% and 1% respectively is often of low resolution but could be improved by the application of the concept of Concentration Duration Curve (CDC). With the aid of the Gasclam (In-borehole continuous gas monitor), four sites were monitored for CH4 and CO2 concentrations, and the time-series datasets used to construct CDC. The result shows that a 5% CH4 concentration is exceeded for 17, 41, 0, and 0% of the monitoring period in sites 1-4 respectively, whilst a 1% CO2 concentration was exceeded for 75, 75.5, 100, and 93% of the time in sites 1-4 respectively. The recorded worst case CH4 concentration are 11.5, 22.1, 2.7, and 1.56% in sites 1-4 respectively while that of CO2 concentration are 8.2, 15.5, 3.3, and 6.71% in sites 1-4 respectively This implies that treating risk in terms of a single occurrence of the worst-case ground-gas concentration rather than any sort of time-weighted function can be defective. While the concept of CDC can be useful in improving risk assessment due to CH4 and CO2, the worst-case ground-gas concentration may not occur during the monitoring period, therefore prediction is required. To predict the worst-case ground-gases concentration requires an understanding of the processes responsible for controlling gas concentration.
© 2021 The Authors. Published by IASE.
This is an
Keywords: Gasclam, Borehole, Ground-gas, Climate change, Gas production rate
Article History: Received 30 April 2020, Received in revised form 28 March 2021, Accepted 27 April 2021
Acknowledgment
The work was funded by Ebonyi State Government of Nigeria under the leadership of His Excellency; Chief Martin N. Elechi with grant number EBSG/SSB/FSA/040/VOL. VIII/046.
Compliance with ethical standards
Conflict of interest: The author(s) declared no potential conflicts of interest with respect to the research, authorship, and/or publication of this article.
Citation:
Nwachukwu AN, Nchedo EN, and Eyong GA et al. (2021). The utility of concentration duration curve in CH4 and CO2 risk assessment. International Journal of Advanced and Applied Sciences, 8(8): 31-35
Figures
Tables
No Table
----------------------------------------------
References (14)
- Boult S, Morris P, and Talbot S (2011). Contaminated land application in real environment (CL: AIRE) bulletin, RB 13. Available online at: https://www.ground-gassolutions.co.uk/
- Boyle R and Witherington P (2007). Guidance on evaluation of development proposals on sites where methane and carbon dioxide are present. Report Edition No. 04, National House Building Council, Milton Keynes, UK. [Google Scholar]
- EA (2004). Model procedures for the management of land contamination. Contaminated Land Report 11, Environmental Agency, Bristol, UK. [Google Scholar]
- McHugh TE and Nickels TN (2007). Evaluation of spatial and temporal variability in VOC concentrations at vapor intrusion investigation sites. In the Vapor Intrusion: Learning from the Challenges, Providence, Rhode Island: 129-142. [Google Scholar]
- Morris P, Todman M, and Boult S (2008). Improved ground-gas risk prediction using in-borehole gas monitoring (IRPIGM). Ph.D. Dissertation, University of Manchester, Manchester, UK. [Google Scholar]
- NHBC (2008). Guidance for the safe development of housing on land affected by contamination. National House Building Council, Milton Keynes, UK. [Google Scholar]
- Nwachukwu AN and Anonye D (2013). The effect of atmospheric pressure on CH4 and CO2 emission from a closed landfill site in Manchester, UK. Environmental Monitoring and Assessment, 185(7): 5729-5735. https://doi.org/10.1007/s10661-012-2979-0 [Google Scholar] PMid:23160719
- Siegrist RL (2003). Sampling technologies for site characterization and long-term monitoring in evaluation of demonstrated and emerging technologies for the treatment and clean-up of contaminated land and groundwater (Phase III). NATO/CCMS Pilot Study, USEPA 542-R-02-011. Available online at: http://www.epa.gov/swertio1/download/partner/2002_special_session.pdf
- Sladen JA, Parker A, and Dorrell GL (2001). Quantifying risks due to ground gas on brownfield sites. Land Contamination and Reclamation, 9(2): 191-208. [Google Scholar]
- Tillman FD and Weaver JW (2005). Review of recent research on vapor intrusion. US Environmental Protection Agency, Office of Research and Development, Washington, USA. [Google Scholar]
- Todman N (2008). Ground-gas monitoring: The way forward. Urban Vision Partnership Ltd., Swinton, UK. [Google Scholar]
- West OR, Siegrist RL, Mitchell TJ, and Jenkins RA (1995). Measurement error and spatial variability effects on characterization of volatile organics in the subsurface. Environmental Science and Technology, 29(3): 647-656. https://doi.org/10.1021/es00003a011 [Google Scholar] PMid:22200272
- Wilson S, Card G, and Haines S (2008). The local authority guide to ground gas. Chartered Institute of Environmental Health, London, UK. [Google Scholar]
- Young A (1992). The effects of fluctuations in atmospheric pressure on landfill gas migration and composition. Water, Air, and Soil Pollution, 64(3): 601-616. https://doi.org/10.1007/BF00483369 [Google Scholar]